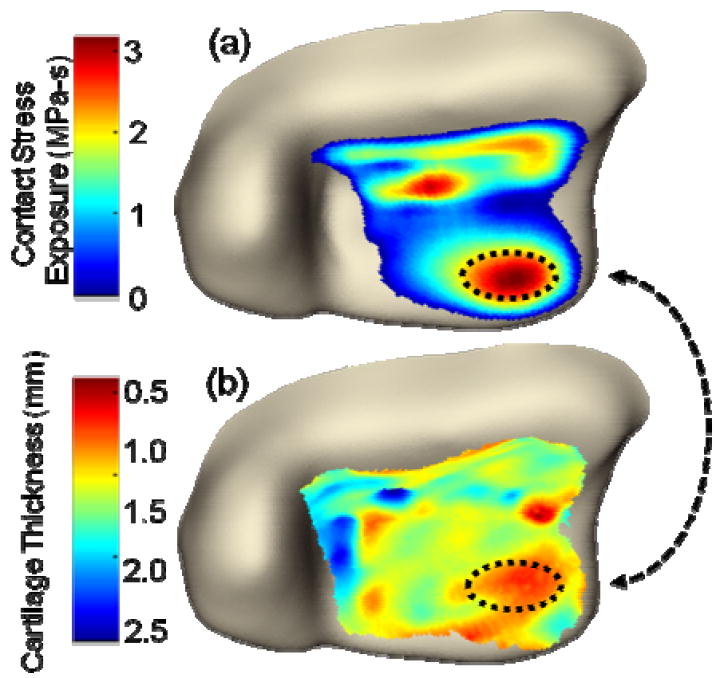
Figure 5.

(A) This finite element plot depicts the habitual contact stress exposure (MPa-s) computed over the joint surface. (B) This contour plot shows the variation in cartilage thickness over the joint surface. Beginning from a situation of assumed uniform thickness (1.7mm), the cartilage showed thinning areas of substantially elevated contact stress.
