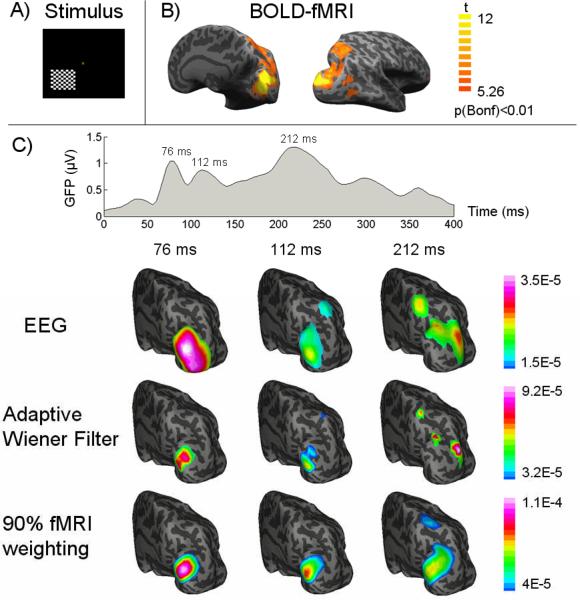
Figure 6.
A) The pattern-reversal checkerboard visual stimulation, B) fMRI activation map with a corrected threshold p<0.01, and C) the global field power of VEP and the dynamic cortical source distribution at three VEP latencies (76, 112, 212 ms after the visual onset) imaged from EEG alone (1st row), or fMRI-EEG integration using our proposed adaptive wiener filter (2nd row) and the conventional 90% fMRI weighted algorithm (3rd row). Both the source images and the fMRI activation map are visualized on an inflated representation of cortical surface. (From [24] with permission)

