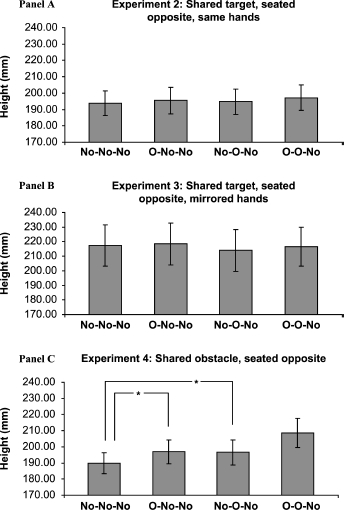
Figure 4.

Means of the maximum height reached for non-obstacle reach trials (n), with their standard errors, for Experiments 2—4. The bars indicated by ∗ show a significant t test result atp < .01. The bars are labelled with the trial type (n-2, n-1, n), where “No” represents non-obstacle trials and “O” where an obstacle was present.
