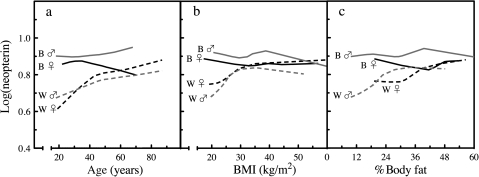
Figure 1.
Exploratory LOWESS (locally weighted scatterplot smoothing) profiles of neopterin, age, body mass index (BMI), and %body fat. LOWESS modeling of log-transformed neopterin values segregated by gender and race were determined as a function of (a) age, (b) BMI, and (c) %body fat. Black dotted lines represent white women, gray dotted lines represent white men, solid black lines represent black women, and gray solid lines black men.

