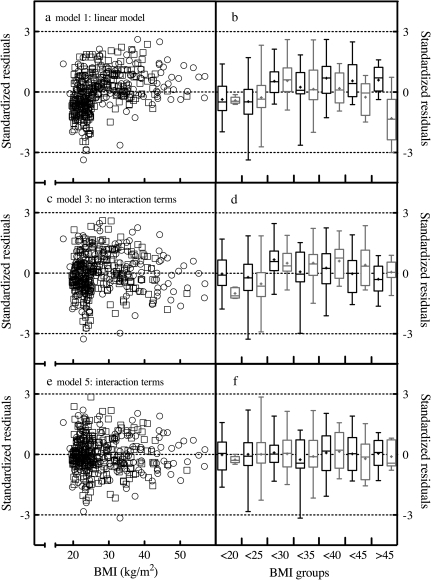
Figure 3.
Residual plots and model fits. Standardized residuals were calculated for multiple regression models using the formula standardized residual = (residual)/ , where MSE is the mean squared error. Scatter plots of standardized residuals as a function of continuous body mass index (BMI) values were generated for (a) the linear model, model 1, (c) the multiple regression model with no interaction terms, model 3, and (e) the final multiple regression model with interaction terms, model 5. Open circles = female; open squares = male. Box-and-whisker plots of standardized residuals where values were grouped in 5 U intervals of BMI were also generated to profile runs above and below zero for (a) model 1, (d) model 3, and (f) model 5. In these box-and-whisker plots, black bars represent women, gray bars represent men, the box frame defines the lower and upper quartile, the whiskers depict maximum and minimum, the line within the box marks the median value, and the “+” symbol marks the mean value.

