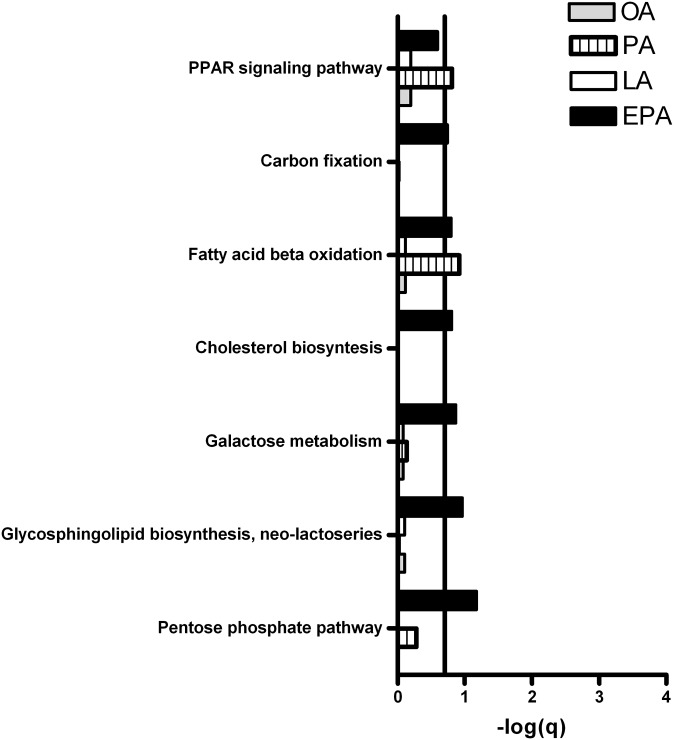
Fig. 10.
Pathways involved in metabolic processes upregulated by fatty acids in myotubes. Myotubes were incubated with fatty acids (100 µM) or BSA (40 µM, control) for 24 h and harvested for RNA isolation. Gene expression was measured by Affymetrix human NuGO Genechip arrays and GSEA was performed to identify pathways regulated by OA, PA, LA, and EPA compared with control as explained in “Materials and Methods.” Pathways with FDR (q-value) < 0.2 (that is, −log(q) > 0.7) were considered significantly regulated. Line marks −log(q) = 0.7, the cut-off for significance for the GSEA. In short, GSEA identifies pathways in which more genes are found to be regulated by microarray analysis than one would expect on the basis of chance. EPA, eicosapentaenoic acid; GSEA, gene set enrichment analysis; LA, linoleic acid; OA, oleic acid; PA, palmitic acid.

