Fig. 6.
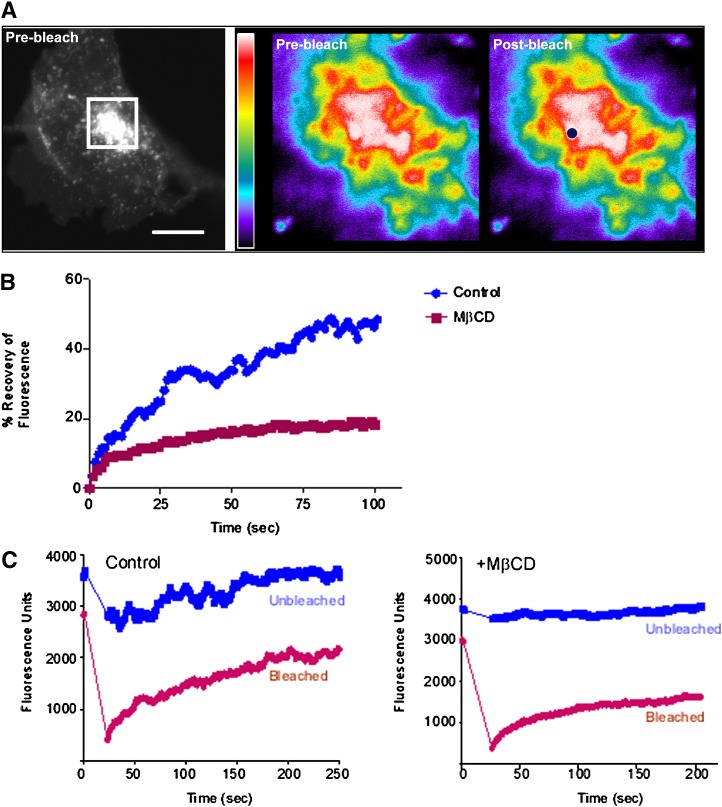
FRAP analysis of eGFP-PI4KIIα on juxtanuclear membranes. A: Illustration of the FRAP scheme. Membranes in the juxtanuclear area of live eGFP-PI4KIIα-expressing cells (boxed) were selectively photobleached in a circular region of interest (ROI). The rate of recovery of fluorescence in such ROIs was then followed over a time course in azide-treated cells, with and without MβCD pretreatment. Scale bar 10 μm. B: FRAP recovery curves for eGFP-PI4KIIα obtained from control and sterol-depleted cells. C: MβCD addition causes loss of TGN membrane continuity. Comparison of fluorescence changes for photobleached and unbleached spots situated 3 μm apart and in the same TGN membrane for control and MβCD-treated cells. All experiments were repeated at least six times with similar results. eGFP, enhanced green fluorescent protein; FRAP, fluorescence recovery after photobleaching; MβCD, methyl-β-cyclodextrin; PI4KII, type II phosphatidylinositol 4-kinase; TGN, trans-Golgi network.

