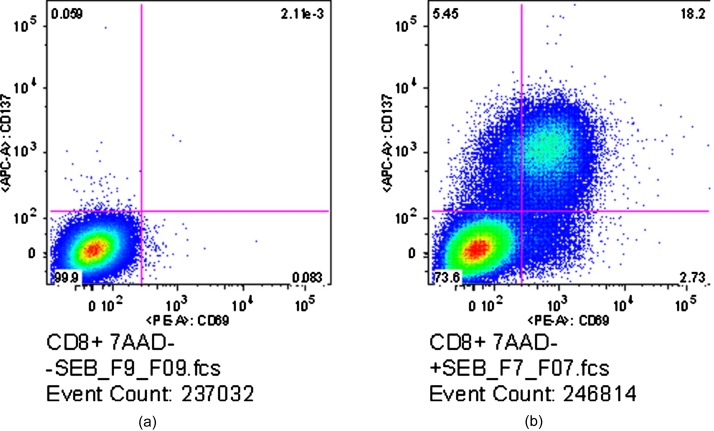
Figure 1.
Flow cytometric results for control (a) and SEB-stimulated (b) CD8+ cells. Stimulation was defined as expression of either CD69 (x axis) or CD137 (y axis). Numbers in each quadrant indicate the percentage of total cells falling into that area. The control sample shows 99.9% of the measured cells as unactivated, while the stimulated sample shows 26.38% are activated.

