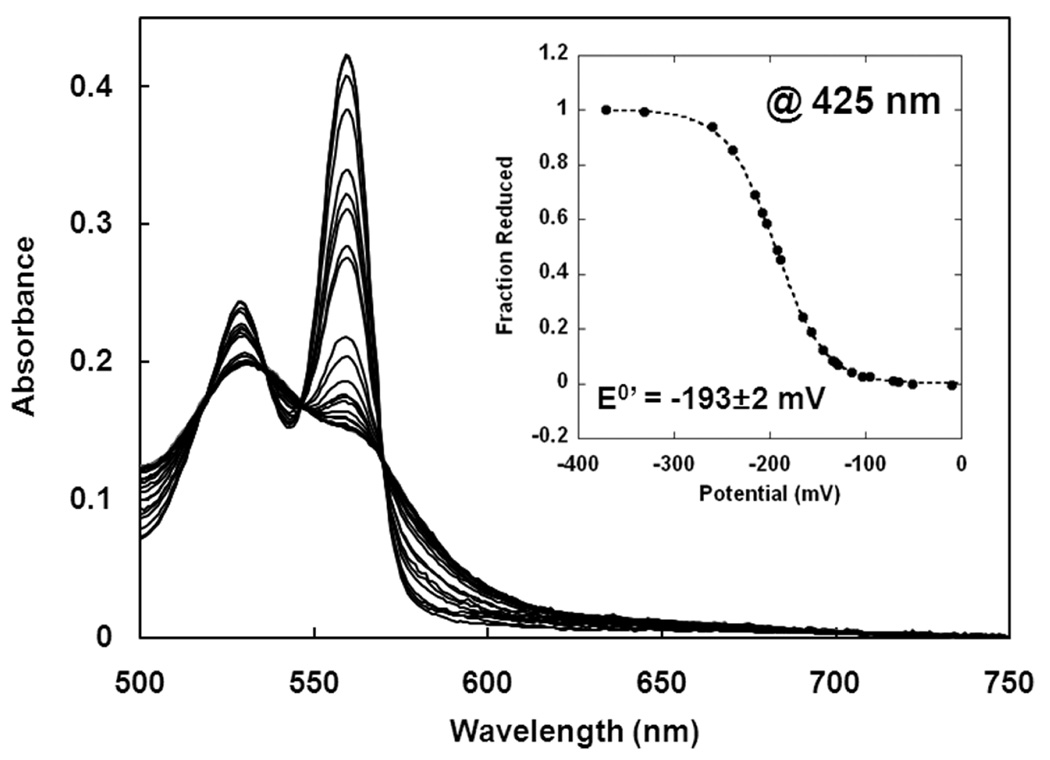
Figure 4.
Spectroelectrochemical potentiometric redox titrations of full-length GLB-6. The intensity of the α-band maxima, A560, of ferrous GLB-6 minus A560 of ferric GLB-6 is normalized and plotted versus the ambient potential (inset). The data were analyzed for the best fit to Nernst equations with n = 1 (inset, dotted line). The measured redox potential versus SHE, E0’, is −193 ± 2 mV, which is an average of three experiments. (Buffer: 100 mM potassium phosphate, 150 mM NaCl, pH 7.0, Temperature = 25 °C).

