Fig 2.

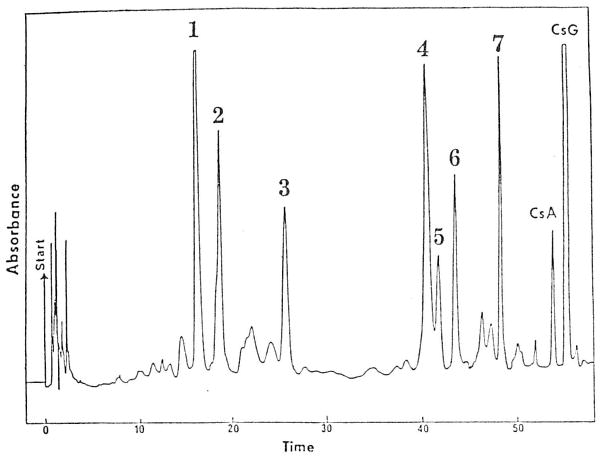
HPLC chromatogram for an ether extract of bile. The patient received CsA; CsG was added to the bile as an internal standard. Peaks 4, 5, 6, and 7 correspond to M17, M1, M18, and M21 isolated by Maurer et al.6

HPLC chromatogram for an ether extract of bile. The patient received CsA; CsG was added to the bile as an internal standard. Peaks 4, 5, 6, and 7 correspond to M17, M1, M18, and M21 isolated by Maurer et al.6