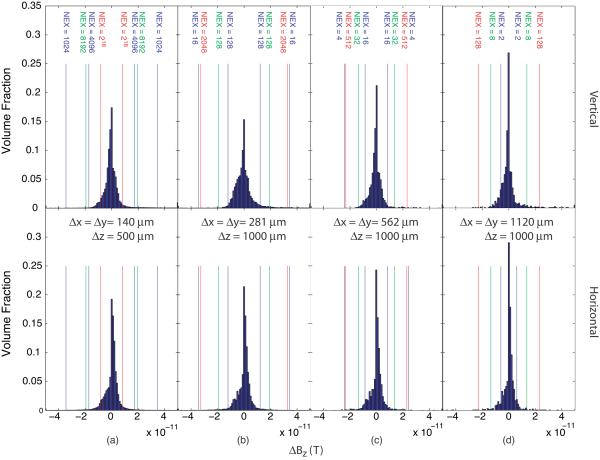
Figure 6.
ΔBz signal distributions compared to predicted noise levels at resolutions of (a) 128 × 128 × 16, (b) 64 × 64 × 8, (c) 32 × 32 × 8 and (d) 16 × 16 × 8, for `subthreshold' current of 90 μA applied along (top) vertical and (bottom) horizontal axes, with resolutions noted on each figure. Lines and excitation numbers relate to noise thresholds at 17.6 T based on the noise measurements at 17.6 T shown in figure 3 The number of excitations required to attain an SNR of 1 relative to the ΔBz distribution for the larger and smaller spike rates are indicated by lines in green (for a spike rate of 28 Hz) and red (a spike rate of 125 Hz) overlaid on the plots.

