. Author manuscript; available in PMC: 2010 Jul 14.
Published in final edited form as: J Am Chem Soc. 2009 Jul 8;131(26):9413–9425. doi: 10.1021/ja902324j

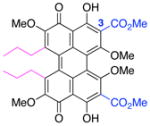
Table 3.

Perylenequinone inhibition of PKC.

PKC IC50 ε670
graphic file with name nihms214818t7.jpg
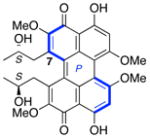
(+)-1, ent-Calphostin D
6.0 μM 120 M−1cm−1
graphic file with name nihms214818t8.jpg
(−)-1, Calphostin D
6.4 μMa
graphic file with name nihms214818t9.jpg
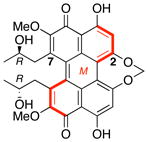
(+)-2, ent-Phleichrome
3.5 μM 225 M−1cm−1
graphic file with name nihms214818t10.jpg
(−)-2, Phleichrome
11 μM
graphic file with name nihms214818t11.jpg
3, Cercosporin
0.60 μM 160 M−1cm−1
graphic file with name nihms214818t12.jpg
epi-3, epi-Cercosporin
12 μM 120 M−1cm−1
graphic file with name nihms214818t13.jpg
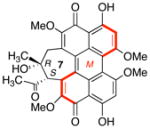
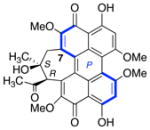
ent-4, Hypocrellin
0.4 μM
graphic file with name nihms214818t14.jpg
4, Hypocrellin A
4.5 μM
graphic file with name nihms214818t15.jpg
48a
0.8 μM 150 M−1cm−1
graphic file with name nihms214818t16.jpg
48b
1.5 μM 360 M−1cm−1
graphic file with name nihms214818t17.jpg
M-16
0.40 μM 480 M−1cm−1
graphic file with name nihms214818t18.jpg
16
1.2 μM 480 M−1cm−1
graphic file with name nihms214818t19.jpg
53
3.5 μM 1430 M−1cm−1
graphic file with name nihms214818t20.jpg
54
4.0 μM 5180 M−1cm−1
graphic file with name nihms214818t21.jpg
57
2.5 μM 1200 M−1cm−1
a

PKC evaluation obtained from reference 23.