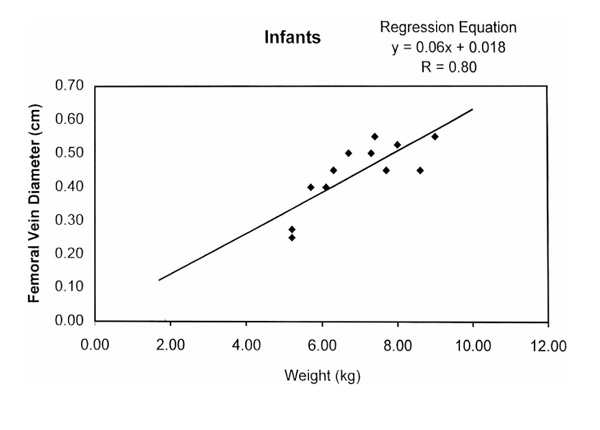
Figure 2.

Scatter diagram showing the relationship between femoral vein diameter and weight in the infant group (♦). The line represents the linear regression equation. This line can be used to estimate the diameter of the femoral vein using a subject's weight. R, Pearson's correlation coefficient.
