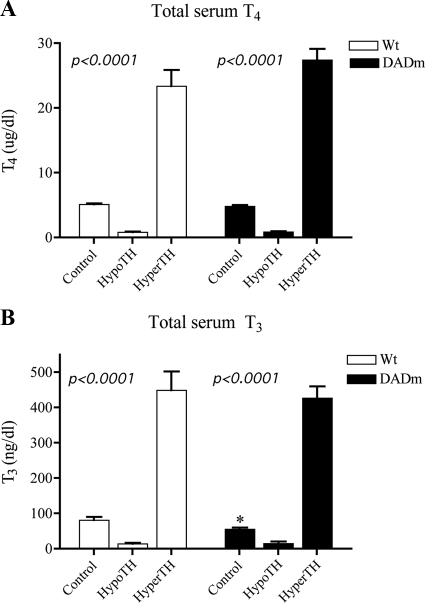
Figure 1.
Total serum T4 and T3 after TH manipulation. TH levels were manipulated as described in Materials and Methods. A, Total serum T4 levels. B, Total serum T3 levels. One-way ANOVA was performed for statistical analysis of treatment variation. Mean ± sem of the hormone levels are shown (n = 5). Wt, Wild type. *, P < 0.05.

