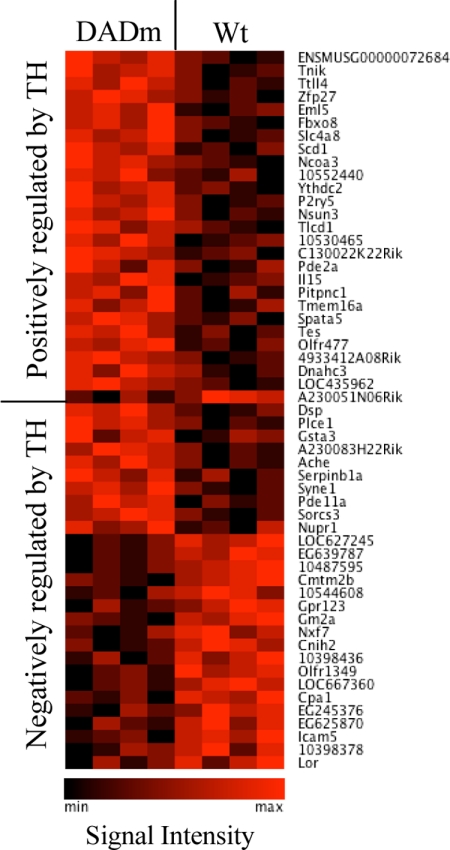
Figure 5.
Pituitary whole gene expression array identified subset of genes that are sensitive to loss of HDAC3 interaction with NCoR in transcription regulation by TH. The heat map (Genesis, http://genome.tugraz.at/) shows different expression levels of TH-responsive genes. Each column represents probe signal intensity for each mouse (n = 4 per group). Wt, Wild type; min, lowest expression; max, highest expression.

