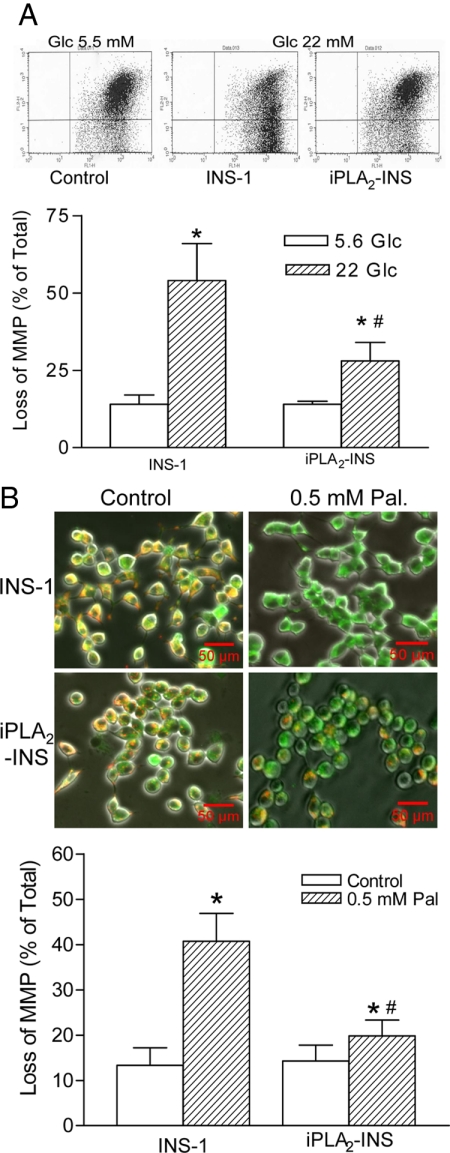
Figure 5.
iPLA2β prevented the loss of mitochondrial membrane potential in INS-1 cells in response to glucose or fatty acids. A, Flow cytometry analysis of glucose-induced loss of mitochondrial membrane potential. INS-1 cells and iPLA2-INS were treated with or without (control) 22 mm glucose for 72 h. The cells were then stained with JC-1 and analyzed by flow cytometry. B, Microscopic analysis of living cells treated with palmitate. INS-1 cells and iPLA2-INS were treated with or without 0.5 mm palmitate for 48 h. The cells were then stained with JC-1, analyzed by fluorescent microscopy, and quantified by flow cytometry. Living cells are stained both red and green, apoptotic cells are stained with green only. Data are presented as the mean ± sem of nine independent experiments. *, P < 0.05, treated groups vs. the controls; #, P < 0.05, the treated iPLA2-INS vs. the treated INS-1 cells. Pal, Palmitate; Glc, glucose.

