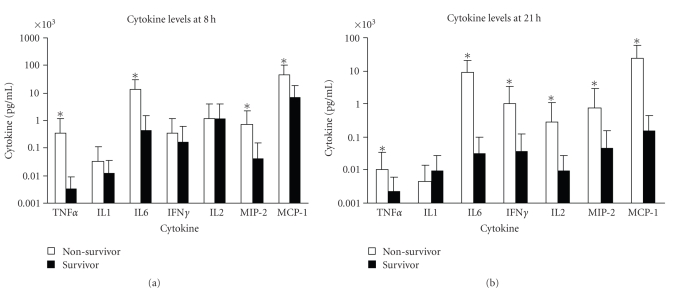
Figure 5.
Serum levels of TNFα, IL-1, IL-6, IFNγ, IL-2, MIP-2, and MCP-1 of mice treated with SEB + LPS (a) 8 hours after SEB administration (b) 21 hours after SEB administration by survival status. Points represent the geometric mean ± standard deviation (SD) for survivors and nonsurvivors of mice treated with SEB + LPS. SEB + LPS group consisted of mice treated with 1 μg SEB + 80 μg LPS, 1 μg SEB + 60 μg LPS, 10 μg SEB + 10 μg LPS, 30 μg SEB + 10 μg LPS, 60 μg SEB + 10 μg LPS, 100 μg SEB + 10 μg LPS, 30 μg SEB + 1 μg LPS, and 100 μg SEB + 1 μg LPS. Values represent the geometric mean ± SD for each group. The “*” indicates P < .05 when survivors were compared with nonsurvivors of toxic shock.

