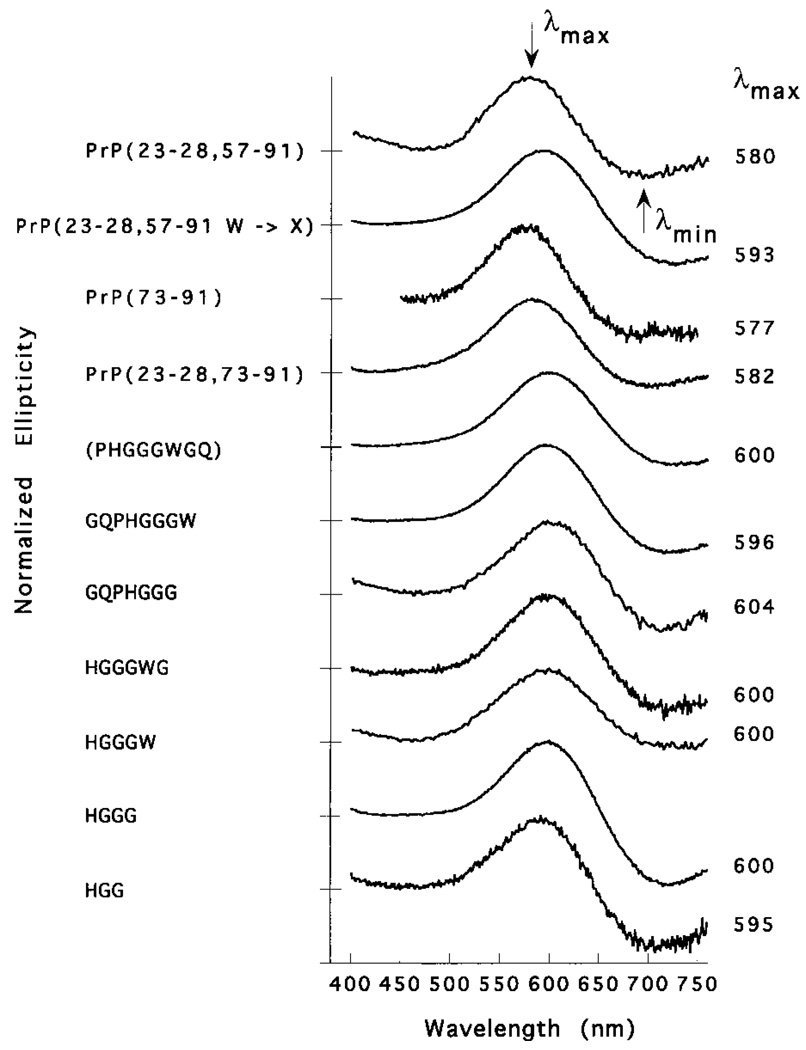
Figure 4.
Visible region CD spectra of all Cu2+/peptide complexes at pH 7.4. The spectra are normalized along the y axis for comparison of λmax and λmin. The approximate baseline for each spectrum is indicated by hatch marks at the left. The λmax of the positive CD band is listed to the right of each spectrum. Because of poor solubility, PrP(57–91) is not included in this figure. All spectra collected at 298 K.

