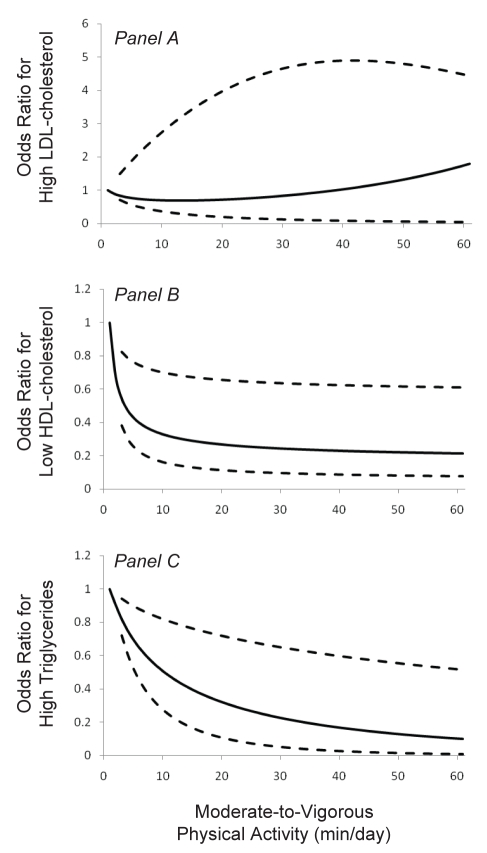
Figure 1).
Odds ratio (OR) for high-risk low-density lipoprotein (LDL) cholesterol values (Panel A), high-risk high-density lipoprotein (HDL) cholesterol values (Panel B) and high-risk triglyceride values (Panel C) according to average min/day of moderate-to-vigorous physical activity (MVPA). A value of 1 min/day represents the referent value (OR 1.0) for MVPA. Solid lines represent the predicted ORs and dotted lines represent the 95% CIs

