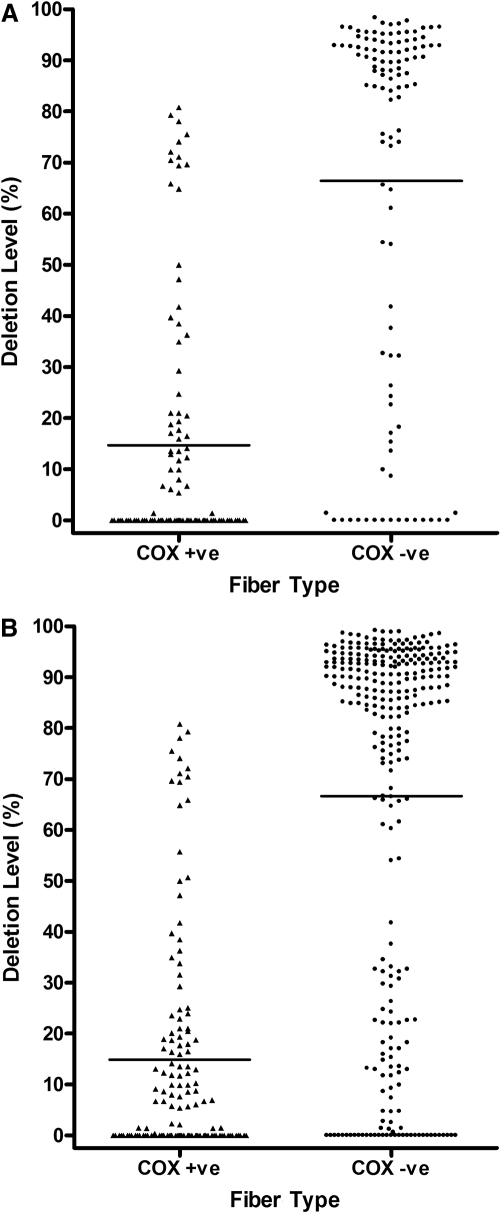
Figure 3.
Level of mtDNA deletion in single COX-positive and COX-negative EOM fibers. (A) Initial group; (B) total group. Horizontal line: mean deletion value. (A) COX-positive, 14.71% (SD 24.13%, n = 103); COX-negative, 66.46% (SD 36.66%, n = 109); (B) COX-positive, 14.86% (SD 22.0%, n = 135); COX-negative, 66.64% (SD 36.45%, n = 284). There was no significant difference in the distribution of mtDNA deletion levels for both COX-positive (P = 0.9581) and COX-negative fibers (P = 0.9634), when comparing the initial and total groups.

