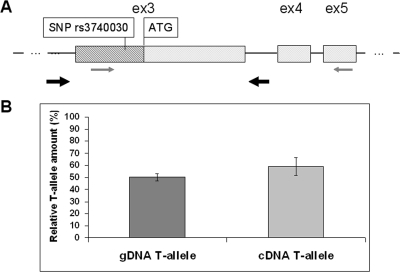
Figure 2.
Quantitative sequencing analysis. (A) Drawing of exons (ex) 3, 4, and 5 of SLC16A12. Exon 3 contains the coding region beginning with ATG (light gray box) and 5′UTR (hatched box) containing SNP rs3740030. gDNA and transcript representing cDNA were obtained from vascular smooth muscle cells of a subject heterozygous for SNP rs3740030 (c.-42T/G). RT-PCR primers are indicated by thin arrows in exons 3 and exon 5. Locations of primers for genomic DNA amplification are indicated with thick arrows in intronic regions flanking exon 3. (B) Quantitative analysis expressed as relative amount of T-allele containing transcripts, given in percentages, for gDNA and mRNA (cDNA). Confidence intervals are shown for eight technical replicas.

