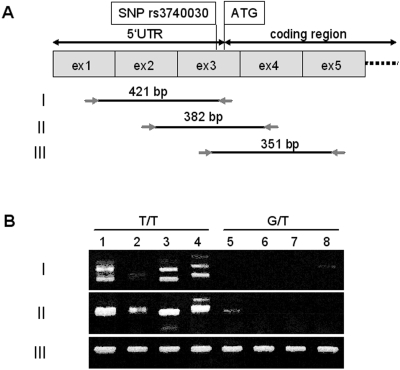
Figure 6.
SLC16A12 transcript analysis by RT-PCR. (A) Schematic representation of exons 1 through 5 (size not to scale). Position of SNP rs3740030 and the ATG initiation codon as well as the 5′UTR and coding regions are indicated above the exons. Primer combinations (I, II, III) and their respective sizes (bp) are shown. (B) Electrophoretically separated RT-PCR products from homozygous T/T (1–4) and heterozygous G/T (5–8) donors of vascular smooth muscle cells.

