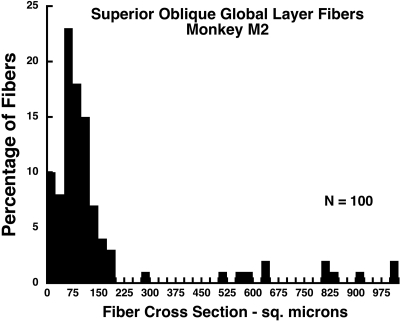
Figure 9.
Histogram of GL fiber cross sections in the right orbit of monkey M2, 60 weeks after right ITN, showing clusters of giant GL fibers among the severely atrophic fibers in the GL. Mode for atrophic fibers is 75 μm2, but some hypertropic fibers exhibited cross sections of up to 1000 μm2 so that the mean for all fibers was 158 μm2. Section were taken 2 mm posterior to the globe–optic nerve junction and are illustrated in Figure 8.

