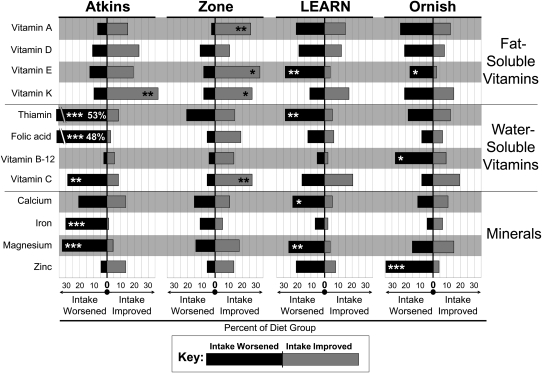
FIGURE 1.
Shifts in risk of micronutrient inadequacy (below the Estimated Average Requirement; EAR) or lower intake (below the Adequate Intake; AI) after 8 wk of the study diets. "Intake Worsened" indicates that the intake at baseline was above the EAR or above the AI for vitamins D and K and for calcium, which do not have an EAR, but below this level at 8 wk. "Intake Improved" reflects the opposite, ie, an intake below the EAR or AI at baseline and above the EAR or AI at 8 wk. Data reflect percentages of the full study population [Atkins, n = 73; Zone, n = 73; LEARN (Lifestyle, Exercise, Attitudes, Relationships, Nutrition), n = 73; and Ornish, n = 72] that fell into these categories. The figure does not show the percentage in each diet group with an intake above the EAR or AI both before and after or below the EAR or AI both before and after (ie, no change in at-risk status). No data are presented for micronutrients for which the percentages of "worsened" or "improved" were <20% and not significant for any of the 4 diet groups (riboflavin, niacin, vitamin B-6, phosphorous, and selenium). McNemar's test was used for differences in the proportion of individuals whose risk of deficiency or inadequacy improved or worsened from baseline to 8 wk. *P < 0.01, **P < 0.001, ***P < 0.0001.

