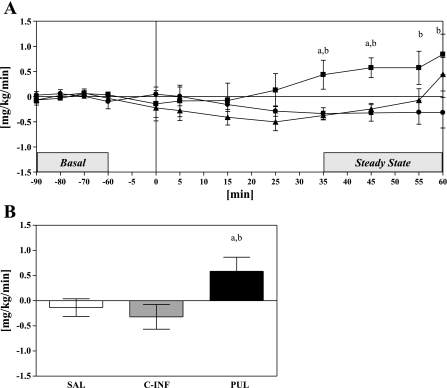
Fig. 4.
A: time course of glucose production during the 60-min experimental infusion protocol, shown as a change from basal: SAL (▴), PUL (■), and C-INF (●). Horizontal solid line represents basal glucose production. B: change in steady-state glucose production, shown as change from basal. Data are means ± SE. P < 0.05, SAL vs. C-INF (a) and C-INF vs. PUL (b).

