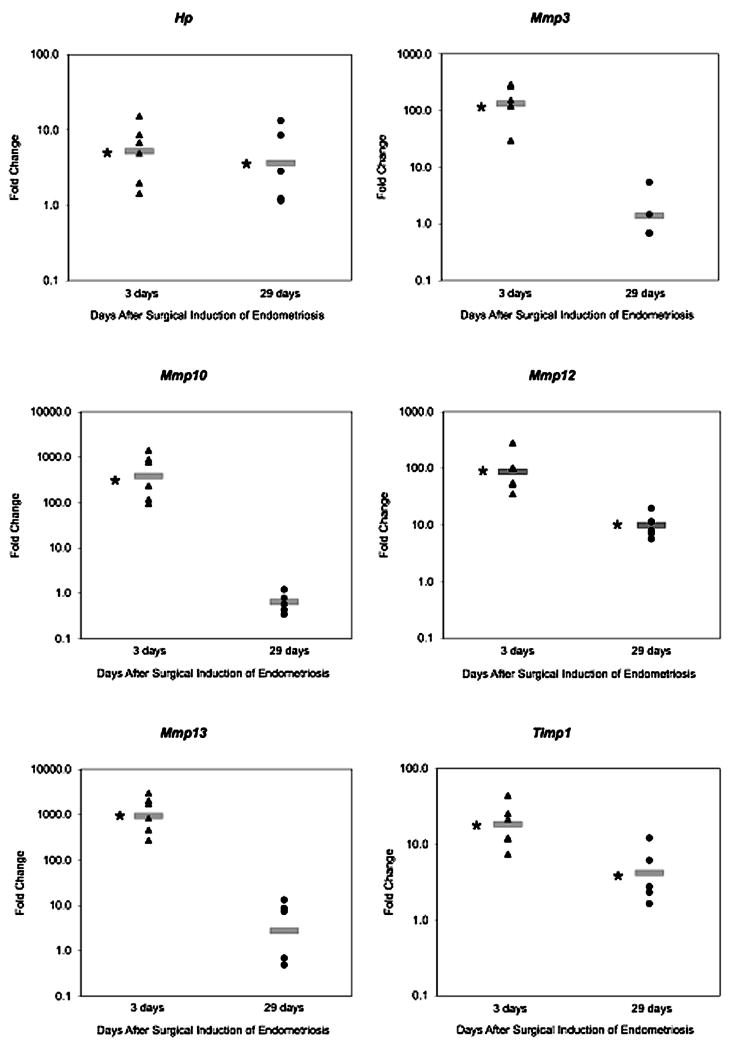
Figure 5. RT-PCR confirmation of microarray results for selected genes.
Endometriotic lesions and eutopic uteri were excised from mice surgically-induced to have endometriosis after 3 or 29 days. RNA was isolated, cDNA generated, and RT-PCR performed and analyzed using the ΔΔCt method (35). Scatter plots show representative fold changes for each animal collected at 3 or 29 days post-induction. Fold change is relative to the eutopic uterus at each time point, and a fold change of 1 indicates there is no difference between gene expression levels in the endometriotic lesion and eutopic uterus. The gray bar represents the average fold change in the endometriotic lesion at each time point. *P<0.05 for average gene expression in endometriotic lesion versus eutopic uterus.

