Fig. 2.
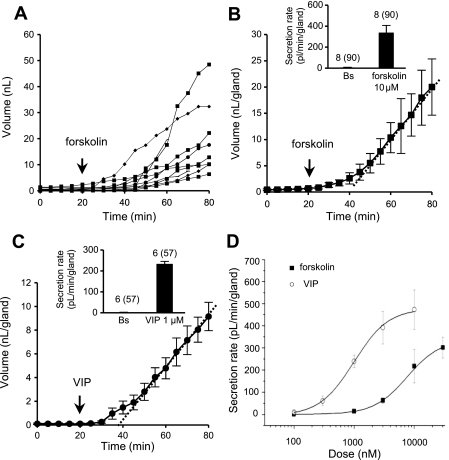
Volume vs. time responses to forskolin and VIP. A: plot of cumulative volume of secretion for each of 10 glands as a function of time and presence of 10 μM forskolin from minute 20. B: plot of mean cumulative volume of mucus from glands in A. Dotted line is best linear fit to volumes from 35 to 80 min; slope of this line is taken as the mean secretion rate for each experiment. In this example, secretion rate was 470 pl·min−1·gland−1 and latency to reach this rate was 30 min. Inset: average secretion rate in 90 glands in 8 ferrets treated with 10 μM forskolin. Bs, basal secretion. C: plot of mean cumulative volume of mucus from 8 glands treated with 1 μM VIP. Dotted line is best linear fit to volumes from 35 to 80 min; slope of this line is taken as mean secretion rate. In this experiment, rate was 151 pl·min−1·gland−1 and latency to reach this rate was 25–30 min. Inset: average secretion rate in 57 glands in 6 ferrets treated with 1 μM VIP. Values (points or bars) are means ± SE. D: dose-response relations for gland mucus secretion to forskolin vs. VIP. Vmax values (in pl·min−1·gland−1) are 338 ± 16 for forskolin and 479 ± 19 for VIP. EC50 values (in nM) are 8,691 ± 1,671 for forskolin and 993 ± 61 for VIP. (For additional information see supplemental Fig. S1.)

