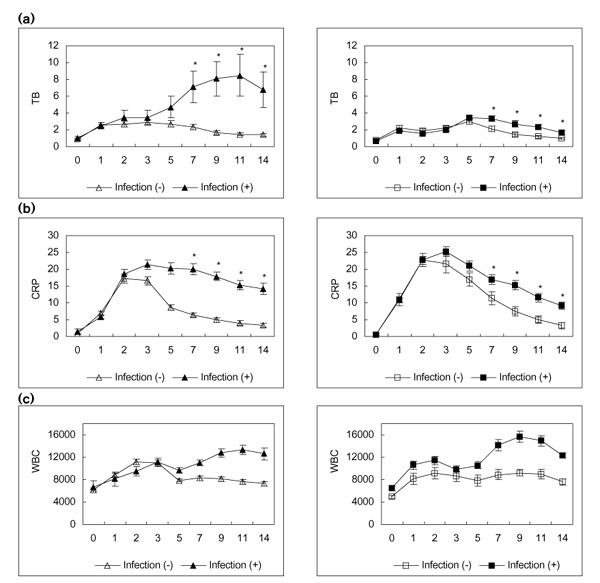
Figure 2.

Patients with hyperbilirubinaemia were divided into two subgroups according to the existence of infection. (a) Course of TB, (b) CRP and (c) WBC in subgroups of each group [left column, C group (open-heart surgery); right column, E group (oesophagectomy)] after operation. Open triangles show each parameter in the C group patients without infection, and closed triangles show each parameter in the C group patients with infection. Open squares show each parameter in the E group patients without infection, and closed squares show each parameter in the E group patients with infection. *P<0.05, versus infection.
