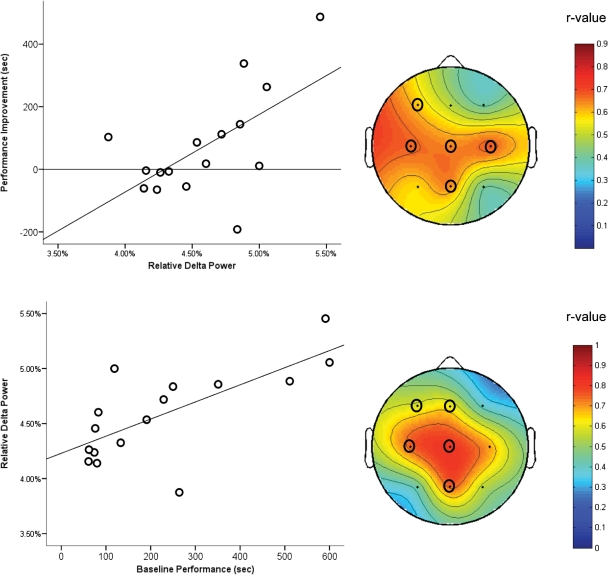
Figure 3.
Performance and delta power. (Top left) Correlation between improvement from last training trial and mean delta power during stage 2 NREM in experienced players. (Bottom left) Correlation between baseline performance and mean delta power across all electrodes during stage 2 NREM sleep in experienced game players. Delta power is expressed as a percent of total power. (Right) Topographic plots depict the correlation between delta power and performance variables at individual electrodes. (○) Indicates electrode cites which retain significance after correction for multiple comparisons.

