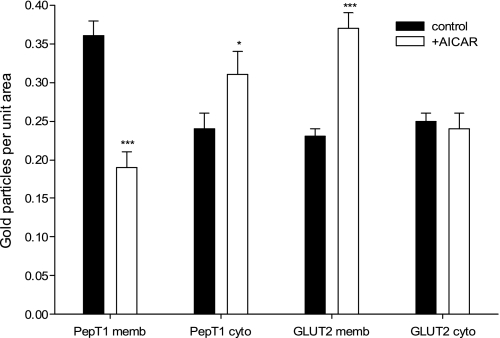
Fig. 5.
Quantification of hPepT1 and GLUT2 transporters in Caco-2 cell monolayers on Transwell filters using immunogold electron microscopy. Quantification of gold particles in control (solid bars) and with 1 mM AICAR treatment for 12 h (open bars) for hPepT1 and GLUT2 in the brush-border membrane (PepT1 memb and GLUT2 memb, respectively) and in the cytoplasm (PepT1 cyto and GLUT2 cyto, respectively). *P < 0.05, ***P < 0.001 compared with relevant control value.

