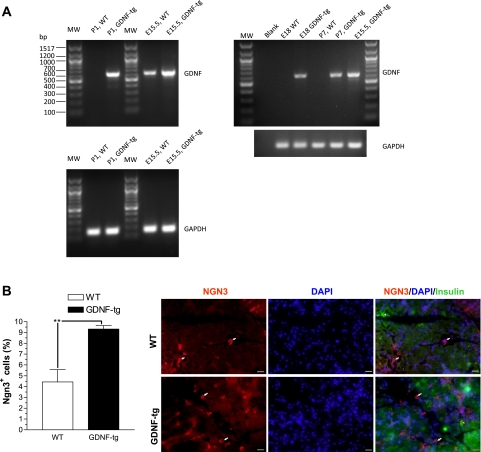
Fig. 2.
GDNF transgenic (GDNF-tg) mouse embryos have more Ngn3-expressing pancreatic cells than wild-type (WT) littermates. A: analysis of GDNF and GAPDH (loading control) gene expression in pancreata from embryonic day 15.5 (E15.5) and 18 (E18) and postnatal day 1 (P1) and 7 (P7) GDNF-tg mice and WT littermates. MW, 100-bp molecular weight marker. B: pancreas sections from E18 GDNF-tg mice and WT littermates immunofluorescently stained for Ngn3 (red) with insulin (green) and 4′,6-diamidino-2-phenylindole (DAPI; blue) nuclear staining. Arrows show representative Ngn3+ cells. Scale 20 μm. Histogram shows a plot of Ngn3+ cell frequency expressed as a percentage of all the cells/field. Plotted are means ± SE (**P < 0.01), N = 3 mice.

