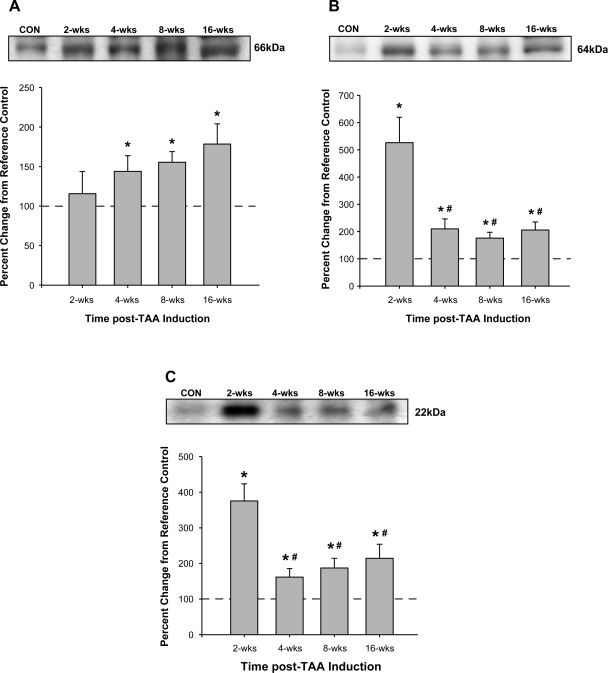
Fig. 2.
Quantitative immunoblot analysis was used to measure membrane type-1 (MT1) matrix metalloproteinase (MMP), MMP-2, and tissue inhibitor of metalloproteinase (TIMP)-2 protein abundance. Values are expressed as percent changes from reference control (CON) animals. A: MT1-MMP was elevated at 4 wk post-TAA induction and progressively increased through the 16-wk time course (*P < 0.05 vs. reference control animals). B and C: MMP-2 (B) and TIMP-2 (C) protein levels were increased at all time points after TAA induction (*P < 0.05 vs. reference control animals). Values of the 4-, 8-, and 16-wk time points were significantly different from peak protein abundance observed at 2 wk (#P < 0.05 vs. 2 wk).

