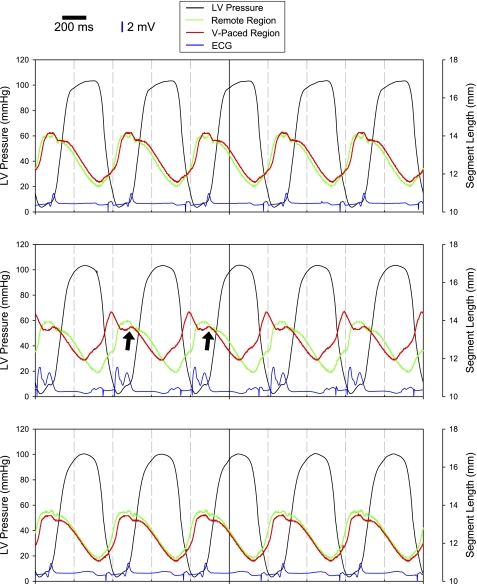
Fig. 2.
Tracings of LV pressure (black lines), ECGs (blue lines), and segmental distances in the remote region (green lines) and ventricular paced (V-paced) region (red lines). With pacing from the atrial site only (top), segmental shortening in the remote and V-paced region were similar in amplitude and phase. Pacemaker spikes before atrial and ventricular depolarization are clearly visible on the ECG tracings. With the initiation of atrioventricular (A-V) pacing (middle) with a shortened A-V interval, which caused the V-paced region to depolarize earlier than the rest of the LV, shortening in the V-paced region occurred earlier than in the remote region. The morphology of the QRS complex clearly shows early ventricular activation due to the introduction of the earlier stimulus followed by a second peak associated with normal ventricular depolarization. However, there was a secondary stretch in the V-paced region as contraction in the remote region was initiated (arrows). Restoration of pacing from the atrial site only (bottom) restored mechanical shortening of the V-paced region Scale bars = 200 ms along the time axis; vertical blue bars = 2 mV for the ECG recordings.

