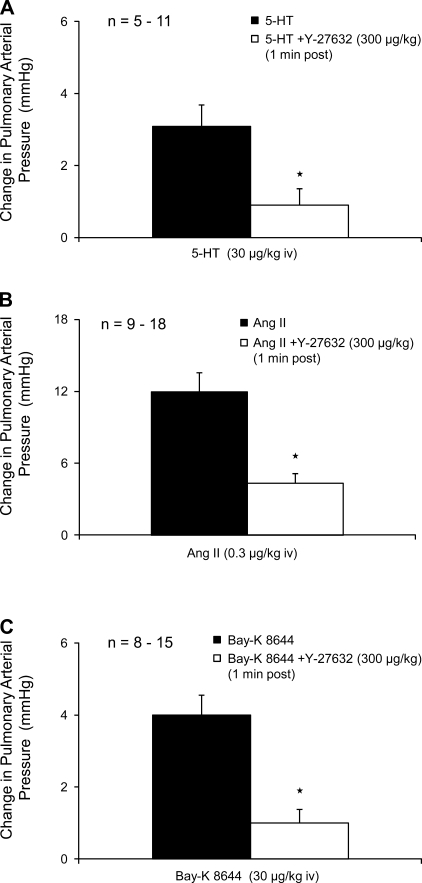
Fig. 6.
Bar graph comparing increases in pulmonary arterial pressure in response to intravenous injections of serotonin (A), angiotensin II (B), and Bay K 8644 (C) in experiments in which the agonists were given before and after Y-27632 (300 μg/kg). n, number of experiments. *Response is significantly different than control.

