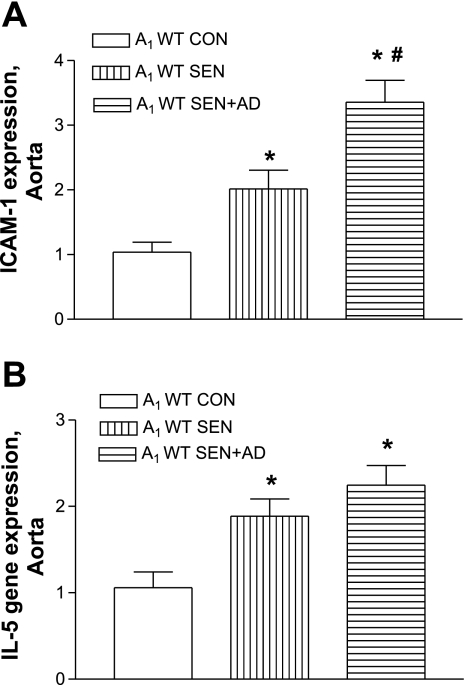
Fig. 4.
Expression of ICAM-1 (A) and IL-5 (B) by real-time PCR in A1WT mouse aorta from CON, SEN, and SEN + AD groups. For gene expression by comparative CT method using real-time PCR, first column was made as the calibrator against which all other groups were compared. Values are expressed as means ± SE; n = 4 mice. *P < 0.05 compared with A1WT CON; #P < 0.05 compared with A1WT SEN.

