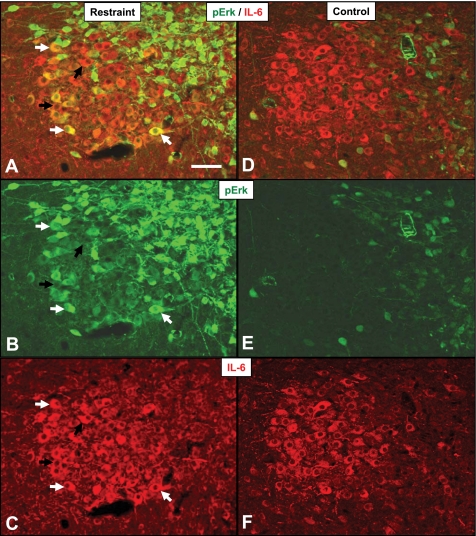
Fig. 7.
Activation of MAPK signaling pathway in IL-6 neurons in stress (A, B, C) animals and controls (D, E, F). Immunoreactivity for phosphorylated ERK (B, E; green) and IL-6 (C, F; red) in the PVN. Merged images show pERK induction in response to stress (A) compared with control animals (D). White arrows denote examples of IL-6+ neurons colocalized with pERK; black arrows denote pERK negative IL-6+ neurons. Scale bar: 100 μm.

