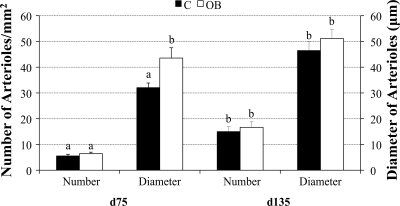
Fig. 1.
Average numbers of arterioles per mm2 cotyledonary (COT) tissue and average diameters of arterioles of control (C) ewes and obese (OB) ewes at both day 75 (C, n = 8; OB, n = 10) and day 135 (C, n = 4; OB, n = 6) of gestation a,bMeans ± SE within a measurement with different superscripts differ (P < 0.05).

