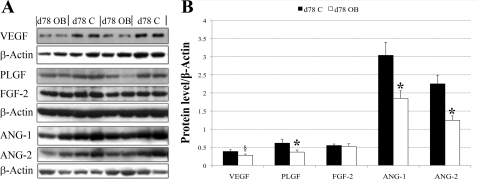
Fig. 5.
Western blot measurement of selected protein expression in COT tissue of both C (n = 8) and OB (n = 8) ewes at day 75 of gestation. A: representative Western blot bands to VEGF, PLGF, FGF-2, ANG-1, and ANG-2 and the reference protein β-Actin. B: statistical analysis on Western blot result of the five proteins in A. Values are expressed as means ± SE; *P < 0.05. Trend toward difference, §P = 0.09.

