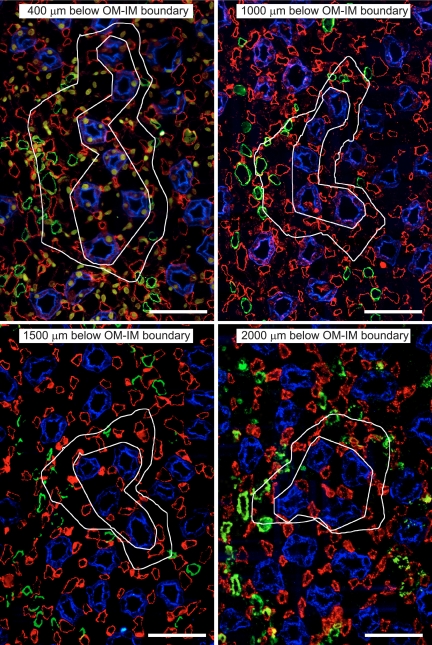
Fig. 1.
Transverse sections showing one single primary collecting duct (CD) cluster (from Fig. 2A in Ref. 28) from four progressively deeper levels below the outer medullary (OM)-inner medullary (IM) boundary [CDs, aquaporin-2 (AQP2)/blue; descending vasa recta (DVR), urea transporter B (UT-B)/green; ascending vasa recta AVR1 and AVR2, PV-1/red]. The inner white irregular polygon of each image outlines the approximate intracluster region. The outer white boundary of each image is the intercluster Euclidean distance map (EDM) border; the EDM border delimits the intercluster region. Scale bars = 50 μm.

