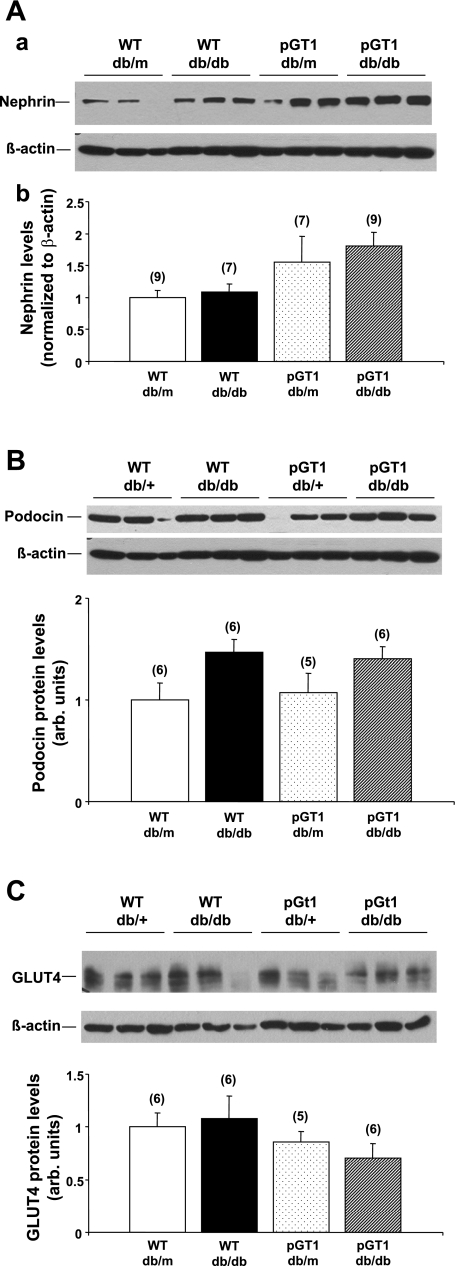
Fig. 7.
Glomerular nephrin (A), podocin (B), and GLUT4 (C) levels in control (db/m) and diabetic (db/db) WT and pGT1 line 1 mice. Top: representative immunoblots of glomerular lysates from control and diabetic mice at 24 wk of age. β-Actin was used as a loading control. Bottom: relative protein levels as determined by densitometry. Data are means ± SE. Number of animals for each group is in parenthesis.

