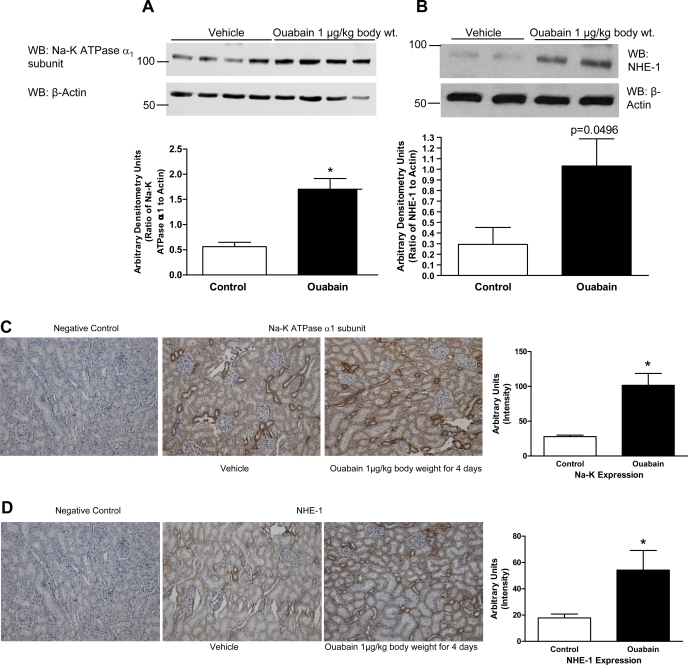
Fig. 2.
Effect of nanomolar ouabain on Na-K-ATPase α1-subunit and sodium/ hydrogen exchanger-1 (NHE-1) expression in kidney BLM. Sprague-Dawley rats, weighing 200–250 g, were treated for 4 days intraperitoneally with ouabain (1 μg·kg body wt−1·day−1). Kidneys were removed on day 4, decapsulated, and the cortex was carefully separated from the medulla. BLM were prepared from whole cortex as described in experimental procedures. Proteins were separated and analyzed by immunoblotting using Na-K-ATPase α1-subunit (A) or NHE-1 (B) antibodies. Bottom: immunoblot for actin in the same blot. A representative blot from 4 (Na-K-ATPase α1-subunit) or 2 (NHE-1) BLM preparations from different animals is shown. WB, Western blot. Each bar represents data as arbitrary densitometry units (AU; ratio of Na-K-ATPase or NHE-1 to actin); values are means ± SE from 8 BLM preparations from different animals (n = 8). *P < 0.05 by ANOVA followed by Bonferroni analysis. C and D: Sprague-Dawley rats, weighing 200–250 g, were treated for 4 days intraperitoneally with ouabain (1 μg·kg body wt−1·day−1). Kidneys were removed on day 4, decapsulated, and fixed in paraffin. Kidney sections (3 μm) were cut and analyzed by immunohistochemistry as described in experimental procedures using Na-K-ATPase α1-subunit (C) or NHE-1 (D) antibodies. The color intensity was measured using Image Pro software. Values are means ± SE in AU from 8 different kidney sections from individual animals. Each section was analyzed at 5–7 different regions and averaged as one value.

