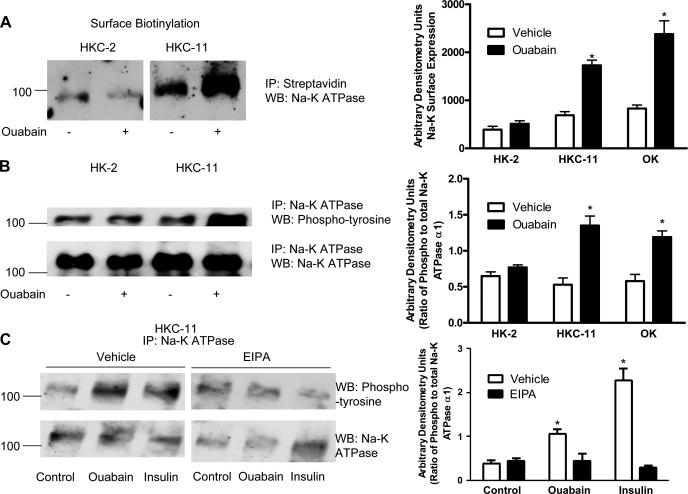
Fig. 6.
Effect of ouabain on Na-K-ATPase α1-subunit expression and phosphorylation. A: cells were treated for 15 min with 10 pM ouabain, and cell surface was biotinylated as described in experimental procedures. Crude membrane proteins were separated by 10% SDS-PAGE and analyzed by immunoblotting using Na-K-ATPase α1-subunit antibodies. Bar graph represents densitometry data from 3 independent experiments in AU. *P < 0.05 by 2-way ANOVA followed by Bonferroni analysis. B: cells were treated for 15 min with 10 pM ouabain, and the Na-K-ATPase α1-subunit was immunoprecipitated as described in experimental procedures. Immunoprecipitated proteins were separated by 10% SDS-PAGE and analyzed by immunoblotting using phosphotyrosine antibodies (top). Bar graph represents densitometry data from 3 independent experiments (AU) as ratio of phosphotyrosine to total Na-K-ATPase band density. *P < 0.05 by 2-way ANOVA followed by Bonferroni analysis. C: cells were treated for 15 min with either 10 nM ouabain or 100 nM insulin in the continued presence or absence of 5 μM EIPA. The Na-K-ATPase α1-subunit was immunoprecipitated as above and analyzed by immunoblotting using phosphotyrosine antibodies. A representative immunoblot from 3 independent experiments is shown. The blots were stripped and probed with Na-K-ATPase α1-subunit antibodies for equal loading (bottom).

