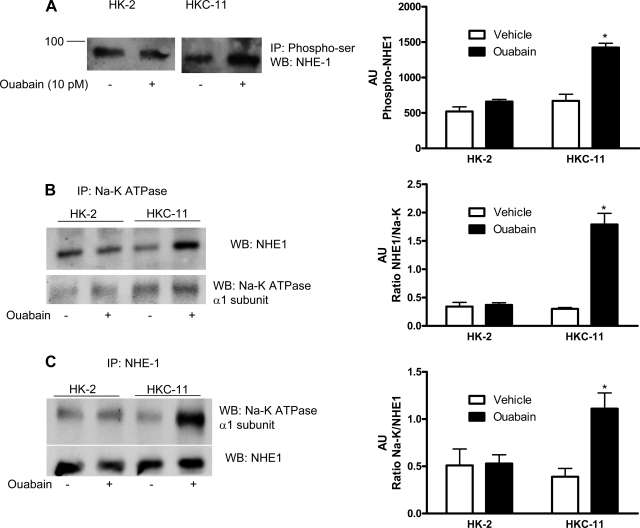
Fig. 8.
Effect of picomolar ouabain on NHE-1 phosphorylation and association with Na-K-ATPase α1-subunit. A: cells were either treated or untreated for 15 min with 10 pM ouabain. Phosphorylated proteins from crude membranes were immunoprecipitated using a phosphoserine/threonine antibody as described in experimental procedures. Immunoprecipitated proteins were separated by 10% SDS-PAGE and analyzed by immunoblotting using NHE-1 antibodies. It was not feasible to run a loading control because there is no reference protein that we can say with assurance remains unchanged. An equal amount of protein from control and treated cells was used. The assumption was made that the immunoprecipitation and immunoblotting efficiency was similar in the treated and control samples. Bar graph represents densitometry data from 3 independent experiments in AU of NHE-1 band density. *P < 0.05 by 2-way ANOVA followed by Bonferroni analysis. B and C: cells were treated for 15 min with 10 pM ouabain, and Na-K-ATPase α1-subunit (B) or NHE-1 (C) was immunoprecipitated as described in experimental procedures. Immunoprecipitated proteins were separated by 10% SDS-PAGE and analyzed by immunoblotting for NHE-1 (C) or Na-K-ATPase α1-subunit (B). The immunoblots were stripped and reprobed with antibodies against Na-K-ATPase α1-subunit (B, bottom) or NHE-1 (C, bottom). A representative blot from 3 independent experiments is shown. Bar graphs represent densitometry data from 3 independent experiments (AU) as ratio of NHE-1 band density to total Na-K-ATPase (B), or as ratio of Na-K-ATPase band density to total NHE-1 immunoprecipitated (C). *P < 0.05 by 2-way ANOVA followed by Bonferroni analysis.

