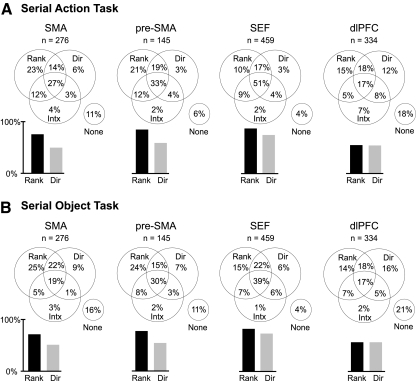
Fig. 2.
Frequency of significant neuronal effects of rank, direction, and their interaction in each area during performance of the serial action task (A) and serial object task (B). Venn diagrams parcel out all possible combinations of effects. Bar histograms give total percentages of neurons exhibiting main effects of rank and direction regardless of what other effects were present. The presence of a main effect of rank indicated that firing varied significantly as a function of rank with the effect of direction factored out, regardless of what other effects were present. Likewise for a main effect of direction.

