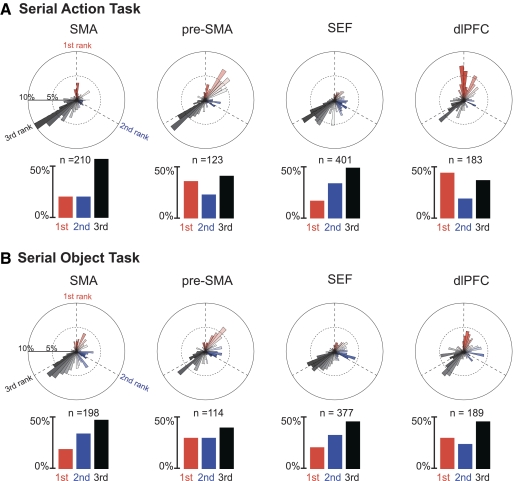
Fig. 4.
Distribution of rank-selective neurons by preferred rank in the serial action task (A) and serial object task (B). Polar plots represent the frequency distribution (radial axis) of neurons according to a continuous measure of preferred rank (theta axis) in which pure categorical rank 1, 2, or 3 selectivity corresponded to 0, 120, and 240° (- - -). Bar histograms represent the frequency distribution of neurons on the basis of which trial phase elicited strongest firing.

