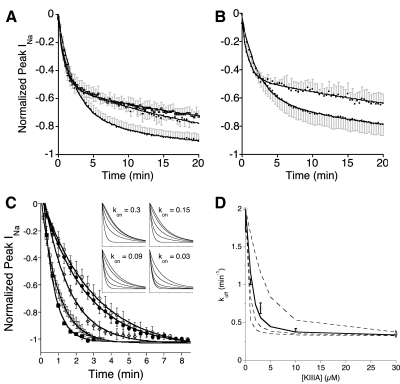
Fig. 4.
Time course of recovery from block when toxins are washed out before all of the channels have been converted into a ternary complex. Experiments were done essentially as in Fig. 2, E and F, except a lower concentration of peptides was used and results were processed as described in methods. A and B: oocytes were exposed first to a saturating concentration (10 μM) of alkaloid for 2 min, followed by 10 μM alkaloid + 1 μM peptide for 4 min before toxin washout. Plotted are recoveries of INa following toxin washout (normalized mean ± SD, n = 3 oocytes). Solid lines represent data fit to double-exponential curves; in each case, fast and slow components had rate constants (see following text) within a factor of 2 of the koff values of the corresponding alkaloid·NaV or peptide·alkaloid·NaV complex, respectively (Table 2). Spans of slow components (fractions of ternary complex formed [FTCFs]) are given in Table 3. A: recovery from block by KIIIA[K7A] and either GTX2/3, TTX, or STX (bottom, middle, and top traces at 20 min, respectively); fast rate constants were 0.45 ± 0.02, 1.9 ± 0.3, and 1.0 ± 0.1 min−1, respectively, and slow constants were 0.025 ± 0.004, 0.04 ± 0.002, and 0.027 ± 0.002 min−1, respectively. B: recovery from block by KIIIA and either GTX2/3 or TTX (bottom and top traces at 20 min, respectively); fast rate constants were 0.43 ± 0.02 and 1.1 ± 0.1 min−1, respectively; slow constants were 0.031 ± 0.004 and 0.02 ± 0.002 min−1, respectively. C: recovery from block following washout after oocytes were exposed to 10 μM STX for 2 min, then for 4 min to 10 μM STX + x μM KIIIA, where x was 0, 1, 3, 10, and 30 (briefest to longest-lasting curves, respectively). Data points represent normalized mean peak INa ± SD (n = 3 oocytes) and solid lines are data fit to single-exponential curves. Insets: simulated curves, obtained as described in methods, when kon values for formation of ternary complex were (left to right, top to bottom) 0.3, 0.15, 0.09, and 0.03 μM−1·min−1 and where for each plot [KIIIA] = 0, 1, 3, 10, and 30 μM (briefest to longest-lasting curves, respectively). Ranges of x and y axes are the same as those of the main experimental plot. Note that of the simulated plots, the pattern of curves in the bottom left, where kon was 0.09 μM−1·min−1, most closely resembles that of the experimental plot. D: decay constants of experimental curves in C, koff (mean ± SD), plotted as a function of KIIIA concentration. Lines plot decay constants of simulated curves in inset of C, where (top to bottom) kon = 0.03 (dashed), 0.09 (solid), 0.15 (dashed), and 0.3 (dashed) μM−1·min−1, with additional decay constants representing those with [KIIIA] of 2 and 5 μM. Correspondence of simulated and experimental data suggests a kon of 0.09 μM−1·min−1, with a proposed uncertainty ranging from 0.03 to 0.3 μM−1·min−1.

