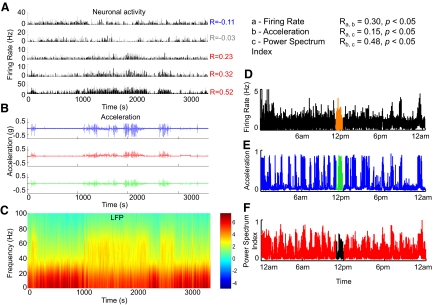
Fig. 3.
Neural activity and acceleration signals recorded in the same mouse. A: firing rates of 5 example neurons recorded in the dorsal striatum (the time bin used is 1 s). The activity of different neurons shows strong positive (e.g., the 3 neurons from bottom) or negative (neuron in the top panel) modulation of firing rate during movement. Some neurons seem to be less modulated, e.g., the neuron shown in the 2nd panel from the top. B: simultaneously recorded acceleration signals along 3 axes (X, Y, Z). C: power spectrum of the simultaneously recorded local field potential. D: Twenty-four-hour recording showing simultaneous recording of single units, acceleration data (E), and power spectrum index of local field potential (LFP) (F). The power spectrum index reflects the relative power of theta and gamma oscillations over beta and delta. Clear correlations are seen between all 3 measures.

