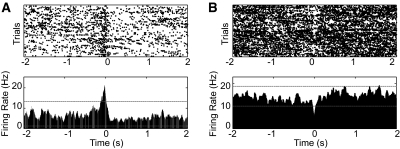
Fig. 4.
Neural correlates of the initiation of a particular spontaneous action in mouse striatum. Time 0 indicates the moment of action initiation, which was defined as the time that the acceleration change exceeded 0.2g in the X-negative direction. Top: trial-to-trial plot where each dot indicates an action potential. Bottom: perievent time histogram (PETH) of the activity of striatal neurons. Examples of positive and negative rate modulation neurons are shown in A and B, respectively. The dashed lines in each figure indicate the significance threshold for positive and negative rate modulation.

