Fig. 6.
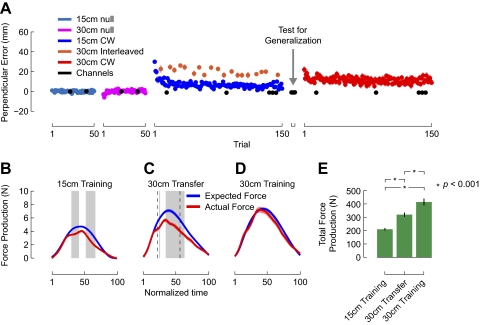
Generalization across an increase in movement amplitude, with 19 interleaved trials. Data are plotted as in Fig. 2. A: movement kinematics show the same pattern as in Fig. 2A. Interleaved trials to the 30 cm target were made in the average force field. Curvature on these movements was reduced by the end of training (orange). B: actual force production at the end of training on the 15 cm target was less than expected. This complicates the interpretation of the underproduction of force shown in C. C: during the test for generalization, subjects again produced less force than expected after training with 19 interleaved trials. D: at the end of training on the 30 cm target, subjects produced the expected forces. E: repeated-measures ANOVA showed that subjects produced more force during the test for generalization to the 30 cm target than they did at the end of training on the 15 cm target. During the test for generalization, they produced less force than at the end of training on the 30 cm target.

