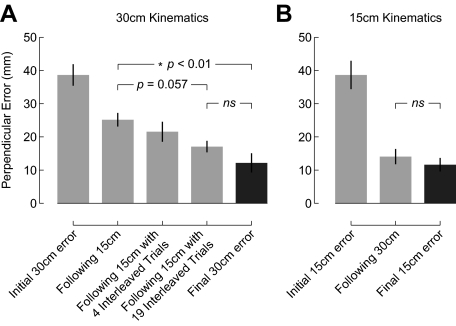
Fig. 8.
Comparison across experiments reveals an asymmetric pattern of generalization. Bars indicate mean ± SE perpendicular error for each of the indicated phases. A: the dark gray bar shows curvature at the end of training on the 30 cm target and represents fully adapted performance. Initial movements to the 30 cm target show large lateral deflections. The extent of curvature on 30 cm movements is reduced if subjects have previously learned the force field on the 15 cm target. If training included 4 interleaved trials to the 30 cm target, initial curvature is reduced further. If training included 19 interleaved trials to the 30 cm target, movement curvature is reduced to the level of fully adapted movements. B: the dark gray bar shows performance at the end of training on the 15 cm target and represents complete adaptation. Initial movements to the 15 cm target are deflected laterally. Initial movements to the 15 cm target show no lateral deflection if subjects had previously learned the force field on the 30 cm target.

